

How Ashland University puts the “Accent on the Individual” every day with unified data
SUMMARY
![]() To address critical challenges, such as maintaining healthy enrollment and student achievement outcomes, Ashland University needed a clearer cost-benefit analysis of its programs. Thanks to the InvokeClarity™ “data lakehouse” solution, the institution can now easily bring disparate data sources together to provide a clearer picture of what students need, and how best to act on those needs, than was ever possible before. EDUCAUSE recognized this work in its 2022 Horizon Report: Data and Analytics Edition (see “Unifying Data Sources”).
To address critical challenges, such as maintaining healthy enrollment and student achievement outcomes, Ashland University needed a clearer cost-benefit analysis of its programs. Thanks to the InvokeClarity™ “data lakehouse” solution, the institution can now easily bring disparate data sources together to provide a clearer picture of what students need, and how best to act on those needs, than was ever possible before. EDUCAUSE recognized this work in its 2022 Horizon Report: Data and Analytics Edition (see “Unifying Data Sources”).
About Ashland University
- Private non-profit university based in Ashland, Ohio
- 6,662 students (undergraduate, graduate, seminary, and online)
- Largest correctional education provider in the country, serving 5,000+ incarcerated students
QUESTIONS
Ashland University has an ambitious, multi-faceted mission. Their emphasis on putting the “Accent on the Individual” involves providing for the needs of each individual student on its campuses, online — and in correctional facilities across 13 states.
“That’s one of the reasons I work here,” said Chief Information Technology Officer Brett Chambers, speaking of Ashland’s commitment to correctional education. “Even taking just a few courses, the recidivism rates drop significantly.”
It’s hard to deny the value of correctional education programs. But the value of higher education isn’t always so clear to the average student today. As the authors of the 2022 EDUCAUSE Horizon Report - Data and Analytics Edition write:
“Public opinion on the value of obtaining a college degree has been trending downward for years, and institutions are falling behind in the task of providing compelling evidence to help improve these opinions.”
To combat this trend and better ensure they were making the best use of resources to attract and serve students, Ashland’s board of directors and administrative and academic leaders sought to answer several key questions, such as:
- Which programs are most effective in connecting students with career opportunities?
- Based on cost vs. benefit to students, which programs should we consider eliminating, adding, or expanding?
- How can we better understand and meet the diverse needs of students enrolling in our programs?
THE CHALLENGE
“My estimation is that it could take as much as 10,000 hours a year in labor to manually massage spreadsheets and produce reports.”
Somewhere in a combination of their private data and public data were multiple “snapshots” of students, of their contexts pre-enrollment, admissions experiences, persistence throughout their programs, and post-graduation lives, that could help address Ashland’s questions.
They had the answers in these snapshots. They just couldn’t fully see them. Data was siloed, stored in so many different places, it was like the snapshots had been torn into tiny bits and tossed into hundreds of separate buckets.
Challenge 1: Reports could pull some of these bits together, but combining them was extremely time-consuming and only provided a partial “snapshot.”
For example, users could pull a report that showed when individual students paid tuition for a course. But if you wanted to know slightly more about demand for that course, such as enrollment by gender, you would need to manually pull in data from a different table.
This was incredibly time-consuming.
“My estimation is that it could take as much as 10,000 hours a year in labor to manually massage spreadsheets and produce reports,” Chambers said.
Challenge 2: Ashland struggled with a lack of data consistency, which made making meaningful, historical comparisons of student data difficult.
Now let’s say one wanted to compare year-over-year enrollment history for Program “X” over the last five years (enrollment data) with gender (demographics data).
What you don’t know is that three years ago, the program code was changed. Program “X” used to be coded as Program “Ex.” This changed the code for the entire history of the program in that data table (enrollment), but not the other (demographics).
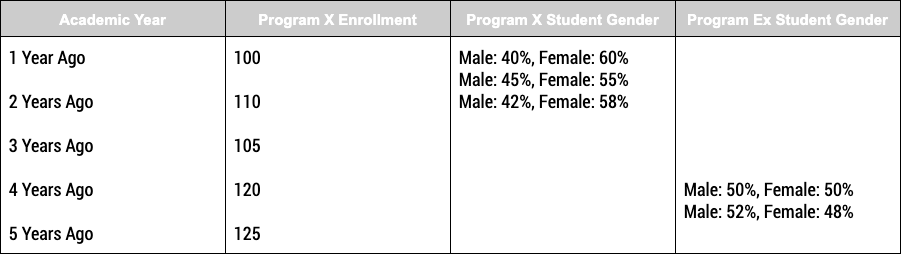
Only after time-consuming research to discover the historical coding discrepancy could one create the complete table, which would make visible key insights. In this hypothetical, enrollment in the program has clearly declined and appears to be skewing female.
Imagine this problem compounded as you add additional data sources—like financial aid amounts, learning management system engagement metrics, advisor intervention, and achievement metrics—and it’s easy to see how the hours were adding up!
THE SOLUTION
“If we had to do all this work in-house it would take a minimum of two years. [InvokeClarity™ ] saved me a considerable amount of time.”
To resolve these problems, Ashland University needed to unify its data. It was the only way to efficiently draw an understanding of the whole student journey, across multiple data tables and through time, to enable strategic decision-making.
Its stakeholders set three objectives in pursuit of this goal:
- Establish data governance policies to standardize coding and minimize the appearance of data loss and confusion.
- Modernize their systems with SaaS (software-as-a-service) solutions to make integration with third-party data analytics software easier today and into the future.
- Adopt a new data platform that would bring all their internal and public data together into one central location.
The first and second objectives will help facilitate the third. Good “data hygiene” will make data inputs more historically stable over time. And the institution’s adoption of cloud-based, SaaS solutions will help “future proof” Ashland from the threat of losing access to historical data.
To satisfy the third objective, Ashland University has begun implementing InvokeClarity™. This SaaS platform from Invoke Learning is the latest evolution of a “data lakehouse.” Designed specifically for higher education, the platform easily pulls in massive amounts of public and internal data and quickly structures it to be queryable.
Chambers has been able to implement InvokeClarity™ in around a quarter of the time he’d expected.
“We’re moving very quickly. If we had to do all this work in-house it would take a minimum of two years. We began in January, and we’re just now wrapping up (in August). It saved me a considerable amount of time”.
THE ANSWERS
“It requires a lot of data from different systems to understand … It all leads to getting a better picture of the student and how they’re engaging.”
With InvokeClarity™, Ashland University stakeholders are starting to see more complete and more frequent student “snapshots,” which help get them the answers they need.
Unifying Internal Data to See the Whole Student
Ashland University is using the platform to pool together internal data—enrollment data from Slate, student success data from advising platform Starfish, engagement data from learning management systems like Blackboard and Canvas, and others—to get a more complete picture of which students are enrolling in what programs, how they’re performing, and much more.
Joining Public Data to Connect with Workforce Needs
They can also more easily make comparisons against public data, such as program enrollment against workforce figures from the Bureau of Labor Statistics, demographics against U.S. Census data, and much more. This gives them a better understanding of the real-world demand for, and value of, their programs, which guides how best to invest in program development.
Historical Stability Makes Trends Visible
In addition, this unified data follows a single set of rules. For example, in accordance with its data governance protocols, Ashland is utilizing Invoke’s native “data_date” column in each table to specify the point in time the data represents. A single update to a data point, such as a GPA, for example, no longer alters the table’s entire history. Each change point across every data element is recorded.
Daily Snapshots to Anticipate Outcomes
Beyond year-over-year or even semester-by-semester reporting, InvokeClarity™ provides Ashland with daily reports. This gives stakeholders real-time snapshots of each student (or group of students) that reveal trends. Behaviors that indicate signs of distress can predict course failure and trigger early intervention to help ensure student success.
Chambers is excited about the insights they’ll glean from holistic snapshots of the student groups that often require the most support, such as first-generation students.
“It requires a lot of data from different systems to understand how a first-generation student ends up enrolling in the first place. Then, how early do they register for classes? What classes do they pick? In what order do they pick them compared with non-first-generation students? How do they engage with their peers and student activities?”
“It all leads to getting a better picture of the student and how they’re engaging.”
THE RESULTS
It will take time for Ashland University to see the impacts on resource management, strategic program development, and student performance that data insights from InvokeClarity™ will bring. But Chambers has already gotten a glimpse of what’s in store for the institution.
Student Success & Retention
“Our students are highly successful once they graduate, but we know we have a segment that will either drop out or not complete. Having a deeper understanding of why that happens and when that happens can help us with intervention.”
Engagement & Achievement
“One of my goals is to have insight into when a student’s going off the rails. To know what causes students at Ashland to fail, or at least not perform up to their potential, because the causes are different at each institution.”
Enrollment & Career Attainment
“I want to find out, how do we help students as they’re transitioning to a career be better prepared to succeed for the companies they’ll work for? I look forward to using data to help those companies become partners with us.”
Ashland University is leading the way.
What’s holding you back today from taking your mission further tomorrow? Find out—and discover just how far you can go.