Solving student success puzzles: How Foothill-De Anza Community College District is addressing equity gaps through engagement style
SUMMARY
 Like all institutions of higher education, the pandemic-era transition to fully online learning triggered critical questions at the Foothill-De Anza Community College District about the potential for widening equity gaps. To find answers, stakeholders needed to better understand completely new student behaviors in real-time. InvokeEngagement™, built on the InvokeClarity™ “data lakehouse” solution for higher education, enabled them to compare engagement patterns within segments to the general student population, providing them with eye-opening insights to guide strategic action. EDUCAUSE recognized this work in its 2022 Horizon Report: Data and Analytics Edition (see “DEI for Data and Analytics”).
About the Foothill-De Anza Community College District
- Foothill College & De Anza College are based in Los Altos Hills, California
- Combined enrollment 60,000 (about 30,000 each)
- Offering 350 online courses per quarter
QUESTIONS
As every college and university did in response to the COVID-19 pandemic, Foothill College and De Anza College quickly went 100% virtual in the spring of 2020. To further meet the learning and safety needs of students, the district provided access to laptops.
But unlike every other institution of higher education in the country, Foothill-De Anza shifted focus from enrollment to concerns around student engagement.
Pre-pandemic, district leaders saw achievement gaps of about four to five percentage points between students in face-to-face (or hybrid) learning and fully online, and they observed gaps by race/ethnicity (detailed below) and income level as well.
Foothill-De Anza stakeholders knew what trends were occurring across enrollment and issues related to diversity, equity, and inclusion (DEI). But they felt that a better understanding of student behaviors—from individuals to demographic segments—would help them begin to piece together why.
- Were achievement gaps by race and income in the online learning environment now more pronounced in online learning than previously seen in face-to-face/hybrid learning?
- What might be causing these gaps to occur?
- How might differences in engagement style be making a difference in achievement outcomes?
THE CHALLENGE
“We’re trying to create a balance between qualitative and quantitative research, looking at behaviors in real time … and what we can do right now to try and improve the experiences for our students.”
The Foothill-De Anza Community College District had the capability to look back and see historical achievement gaps. But no historical analysis could provide the answers they needed in the midst of an unprecedented global pandemic.
“We all have traditional metrics in trying to identify gaps in progress, student success outcomes, grades, degree attainment, etc.,” Dr. Ulate explained in a fall 2021 webinar. “But one of the things that’s missing in these contexts is real-time data that will help us understand why the outcomes might be happening.”
Challenge 1: Gaining access to this data in a way that allows for rapid analysis.
Massive amounts of real-time data are just white noise unless you have the means to quickly translate it into possible narratives. Dr. Ulate framed this as the debate between quantitative vs. qualitative research.
“What we would like to do is get student focus groups, ask questions, transcriptions, coding, all that. But that takes time and resources we don’t have. Instead, we’re trying to create a balance between qualitative and quantitative research, looking at behaviors in real time … and what we can do right now to try and improve the experiences for our students,” Dr. Ulate said.
Data like this could spark more and better questions, such as, Are different student groups using remote learning resources differently, and how?
Challenge 2: Avoid jumping to conclusions.
Dr. Ulate chose his words carefully when he talked about why outcomes might be happening. In any comparison in student outcomes, he explained, it’s important not to confuse correlation (an observed relationship between data sets, X and Y) and causation (X caused Y, or vice versa).
To have fruitful conversations beyond assumptions or anecdotes, they needed real-time data structured in a way that could be used easily. This was the key, not to finding all the answers immediately, but to developing more targeted hypotheses to serve as a guide for new initiatives and further analysis.
THE SOLUTION
“Invoke Learning is bringing to light different relationships that we hadn’t thought about before, or seeing similar relationships but in completely different ways.”
In the spring of 2020, district stakeholders deployed InvokeEngagement™. Built on the InvokeClarity™ “data lakehouse,” this AI-enhanced dashboard built exclusively for higher education was just the window into real-time student behavior they needed.
“Everything we do has a DEI component to it,” Dr. Ulate said. “One of the things Invoke Learning is bringing to light is different relationships that we hadn’t thought about before, or seeing similar relationships but in completely different ways.”
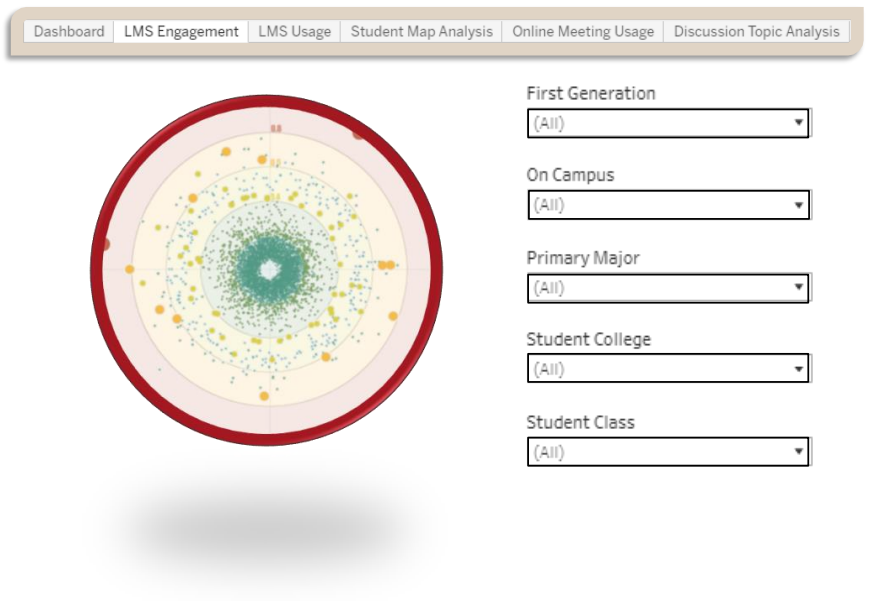
InvokeEngagement™ features an “engagement bullseye” chart. Drawing from dozens of traditional engagement indicators, the graphic maps highly-aligned (“highly engaged,” by traditional metrics) students nearer the center, less-aligned students further from center.
 The engagement factors considered are twofold:
- Traditional factors include behaviors such as regular logins to the learning management system, posting to discussion boards, checking their grades, etc.
- Behavioral characteristics include psychometrics that relate to student success, such as measures of resilience, commitment, grit, and drive.
Looking at Foothill College as the test case, stakeholders could see at a glance how well-represented the student body was in the “green,” i.e. inner rings, signifying traditional engagement. Each dot represented an individual student’s “engagement fingerprint.”
From there, Dr. Ulate and colleagues could “slice” the data in many different ways to compare demographic groups of interest against the student body as a whole. This allowed them to analyze how similar or dissimilar each group’s engagement pattern was to the general population.
The initial student segments included were:
- Race/Ethnicity - Black, Asian, Latinx, White, Filipinx
- Student Type* - Continuing, Concurrent, First-Time, First-Time Transfer, Returning
(*See the video webinar, above, for Foothill-De Anza’s definitions of these terms.)
THE ANSWERS
“By increasing the outcomes for smaller groups of students, we start creating pockets of success, build confidence, and then scale out and increase success for a larger group of students.”
Their key findings included eye-opening insights.
Students are scored on a scale of 0 to 1, with 0 representing the bullseye and 1 representing the outermost ring.
- All race/ethnicity groups had a highly traditional engagement pattern in at least 89 percent of their population (engagement score of 0-0.2).
- However, among students showing an atypical engagement pattern (engagement score of 0.6-1), Black and Latinx students were overrepresented.
- Students that fell into concurrent (dual enrollment) and first-time (no prior college experience) categories were also overrepresented among students with an atypical engagement pattern.
For the first time, Foothill-De Anza had evidence that suggested, in real-time, that a disparity in engagement style might have something to do with a correlated historical disparity in outcomes.
And they had evidence to guide the selection of groups to prioritize for further study (Black, Latinx, dual enrollment, and first-time college students).
THE RESULTS
“Within the first week, maybe two weeks of a course, we can start assessing students on how likely or not they are to perform as highly as their peers based on their engagement levels and positively support them in a personalized way.”
As Dr. Ulate and colleagues better understand student behaviors in real-time, they can be more strategic about testing hypotheses, building predictive models, and providing the personalized help that each student group, even each individual student, needs.
Engagement and Student Success
“I’d like to think we can get to the point where within the first week, maybe two weeks of a course, we can start assessing students on how likely or not they are to perform as highly as their peers based on their engagement levels and positively support them in a personalized way.”
Diversity, Equity, and Inclusion for All
“Whether it’s outreach or support services, the idea is that by increasing the outcomes for disproportionately impacted students, we can start creating pockets of success, build confidence, and then scale out and increase success for a larger group of students.”
Enrollment Strategy
“We’re starting to dive into enrollment data within InvokeClarity™ now. As we identify common characteristics or actions of students who might need that nudge to enroll and to stay enrolled, then instead of doing that for all our students, we can focus (on that segment).”
The Foothill-De Anza Community College District is leading the way.
What’s holding you back today from taking your mission further tomorrow? Find out — and discover just how far you can go.


